Autonomous intelligence for oncology clinical trials
ScienceClaw continuously monitors oncology clinical trial registries for design anomalies, synthesises trial signals with daily news intelligence, and delivers findings as email and a live website.
What it does
Synthesised Trial Intelligence
A daily KB-building cycle scans oncology news across five topic areas, cross-references confirmed trial findings, and synthesises intelligence into evidence-backed insight records. Published weekly to Insights after Kimi K2.5 compliance verification.
Clinical Trial Anomaly Detection
Builds empirical baselines from 4,000+ oncology trials at the indication–modality–line-of-therapy level. Scores each new trial across six deviation dimensions, investigates through six public APIs, and reports only findings passing a three-part confidence filter. Raw findings at Findings.
Design principles
The opportunity
Life sciences teams spend significant time on two recurring problems: gathering and synthesising market intelligence across fragmented sources, and tracking the design landscape of clinical trials in their therapeutic area. Both are manual, repetitive, and error-prone.
For market intelligence, competitive landscapes shift daily. Clinical trial readouts, regulatory decisions, and partnership announcements can alter strategic priorities overnight. Most organisations respond with periodic, manual research cycles — quarterly reports, ad-hoc analyst requests, internal briefings that are stale before they're circulated. ScienceClaw replaces that with a continuous, autonomous research process. The knowledge base grows every day. Cross-domain connections that analysts often miss are surfaced automatically. On-demand queries combine accumulated intelligence with targeted web searches, and every outbound communication is verified by an independent AI model before delivery.
For trial intelligence, no systematic method exists for continuously detecting when a newly registered trial's design deviates from established norms. Commercial intelligence services address this through curated databases and periodic reports, but these are retrospective, expensive, and optimised for landscape coverage rather than early signal detection. ScienceClaw builds empirical baselines at the indication–modality–line-of-therapy level from 4,000+ real trials, scores each new trial using a weighted composite formula, investigates anomalies through eight public biomedical APIs, and reports only findings that survive a three-part confidence filter. The first operational deployment surfaced confirmed high-impact findings including novel PARP inhibitor designs in bladder cancer and the first 4-1BB agonist to reach Phase 3 in NSCLC.
Both workflows share the same interface — email — and the same design philosophy: evidence only, gaps flagged, human always in the loop.
This is not a chatbot. It is a set of structured research and surveillance workflows with anti-hallucination guardrails, cross-model verification, baseline-deviation anomaly detection, and a self-expanding topic registry. The AI is a component of the system, not the system itself.
Method
Insights Method
KB-Building & Synthesis Workflow
The Insights tab is produced by a daily KB-building cycle: news scanning, two-pass topic analysis, cross-synthesis, and insight record extraction — the same architecture described in the paper below, now configured for the oncology clinical trial landscape.
Download the methods paper v1.1 (PDF)How it works
You send an email
Tag the subject line with [MARKET RESEARCH] and your topics. Describe what you need — competitive landscape, pipeline comparison, regulatory outlook. The system extracts intent and entities from your query using natural-language parsing with entity recognition.
Evidence is gathered from the knowledge base and web
The platform matches your topics against its accumulated intelligence: daily market briefs, cross-domain synthesis notes, and news scan tags. When the knowledge base has gaps, targeted web searches constructed from extracted entities supplement the KB evidence. A source quality hierarchy weights claims: peer-reviewed sources highest, vendor press releases lowest.
AI produces a sourced analysis
The analysis model reads the gathered evidence alongside your question. It is instructed to use only the provided evidence, separate facts from interpretation, and attribute every factual claim to a specific source. Missing data is flagged, not filled with plausible guesses.
A second AI verifies the response
Before sending, an independent verification model checks the draft against a meta-guardrail: scope compliance, evidence standards, vendor neutrality, and tone. This cross-model verification prevents the blind-spot problem of self-verification — the model that writes the analysis is never the model that checks it.
You receive a verified memo
A reply arrives in the same email thread, structured as: Key Takeaways, Supporting Evidence, Risks and Unknowns, and Recommended Next Steps. Every factual claim traces to a specific source. If the evidence is weak or contradictory, that's stated clearly rather than papered over.
What makes this different
Knowledge-base grounded with web fallback
Every claim traces to a specific source in the knowledge base or a cited web search result. The daily autonomous cycle builds a cumulative intelligence layer; on-demand queries supplement this with targeted searches when coverage gaps are detected. A four-tier source quality hierarchy ensures vendor press releases are weighted below peer-reviewed evidence.
Cross-model verification
The model that generates the analysis is never the model that verifies it. A separate language model checks every outbound communication against a meta-guardrail document — verifying scope compliance, evidence standards, vendor neutrality, and tone. If the check fails, the draft is revised and re-verified before sending.
Autonomous term discovery
The system doesn't just track what you've told it to watch. A term discovery mechanism continuously identifies new vendors, products, and technologies from daily news scans. Discovered terms are added to the vocabulary and expand future search coverage — with scope filtering governed by the same meta-guardrail that governs outputs.
Cross-topic synthesis built in
The daily research cycle includes a dedicated synthesis stage that reads across all topics to find connections, contradictions, and emerging trends. On-demand queries can surface relevant signals from adjacent areas that a siloed analyst might miss.
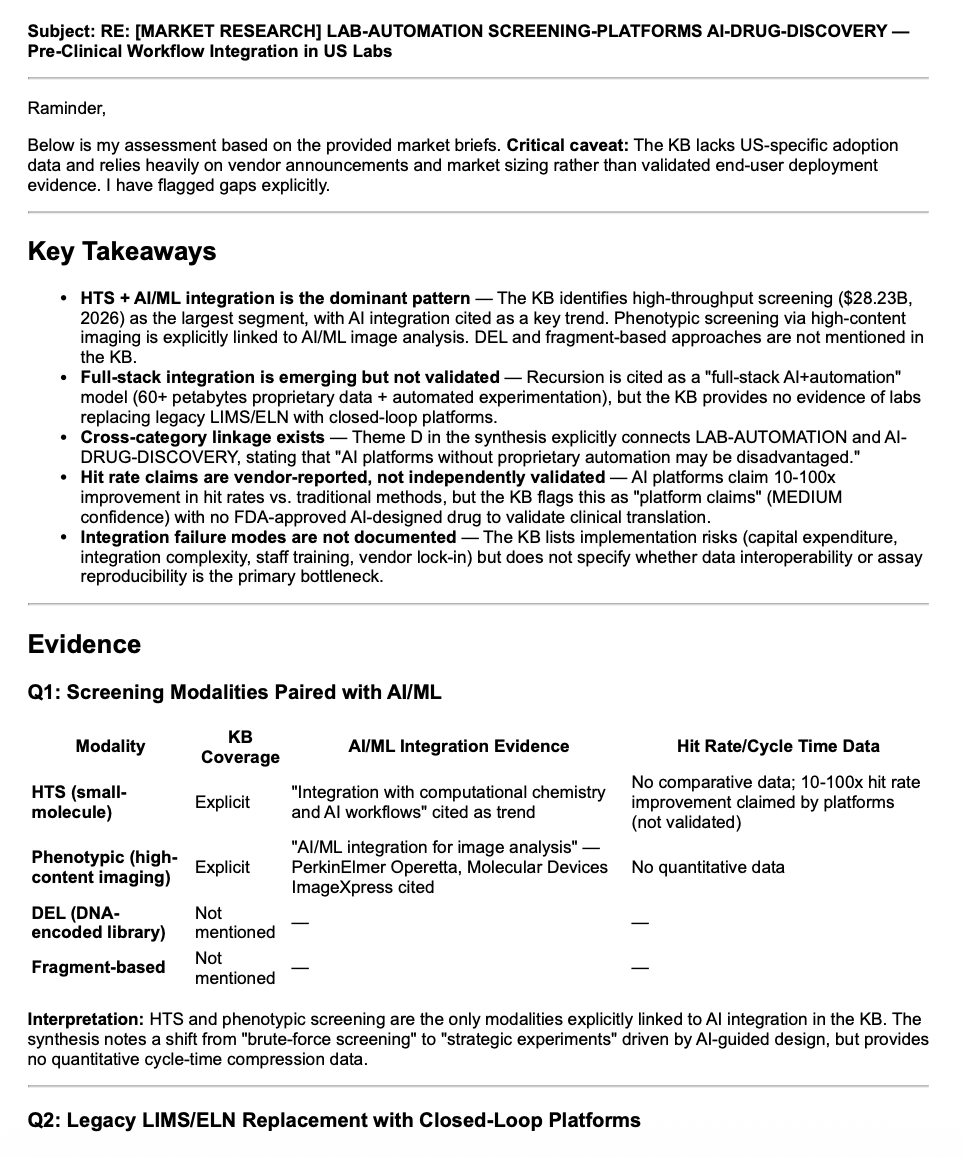
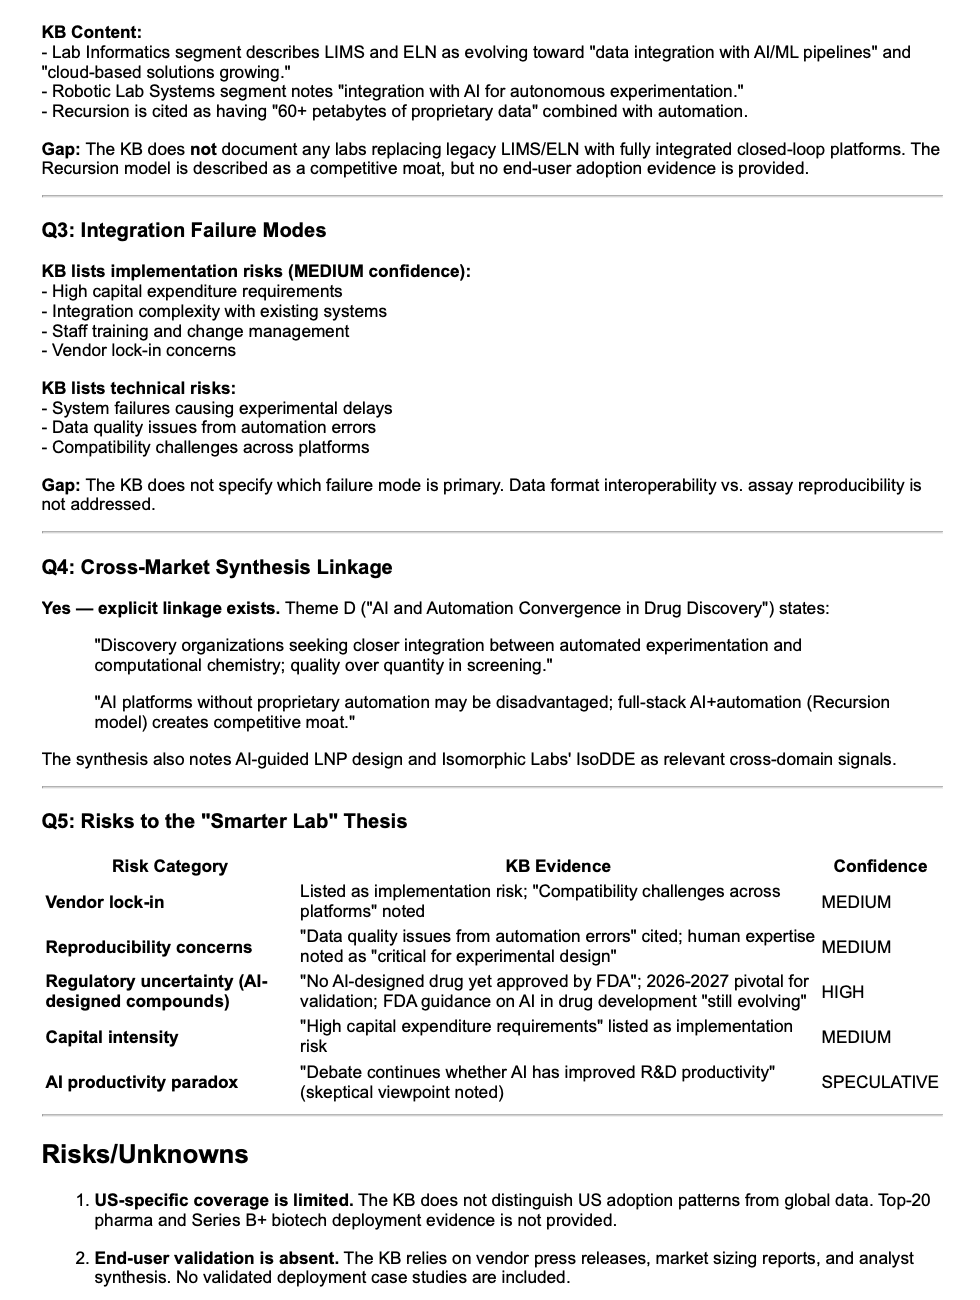
Example output
The following illustrates a real on-demand research response produced by the same KB-building pipeline, configured for a different vertical. In the oncology configuration, the pipeline produces daily synthesis over checkpoint combinations, ADC pipeline, bispecifics, biomarker enrichment, and regulatory endpoint shifts.
Self-expanding research coverage
The Insights cycle doesn't only cover the five seed topics. Two mechanisms expand coverage. First, the daily retrospective detects signals that don't match existing topics and proposes new research areas for operator review. Second, term discovery identifies new drugs, mechanisms, sponsors, and indications — each proposal requiring two independent source signals before review.
You reply to topic proposals with a simple approve or reject command. Approved topics immediately join the daily research cycle and become available for on-demand queries. Discovered terms are filtered by the meta-guardrail to ensure they fall within the system's defined scope before being added. The platform gradually expands its coverage toward where the market is moving, not just where you originally pointed it.
Guardrails: a meta-guardrail document defines the system's scope and behavioural rules. Every outbound communication is verified against this document by an independent language model before sending. The AI can propose at most three new topics per day, each requiring at least two independent source signals. Your manually curated topic registry is never modified automatically. All proposals require explicit human approval before activation.
Method — Oncology Trials
Findings Method
Trial Intelligence Workflow
Automated anomaly detection for oncology clinical trial design. Focused exclusively on oncology — checkpoint inhibitors, ADCs, bispecifics, cell therapies, targeted agents, and more. The system builds empirical baselines at the indication–modality–line-of-therapy level from 4,000+ real oncology trials, scores each new trial using a weighted composite formula, investigates high-scoring deviations through public biomedical APIs, and reports only findings that survive a three-part confidence filter.
Download the methods paper v0.4 (PDF)How it works
Baselines are built at indication–modality–line level
For each indication–modality–line-of-therapy triplet (e.g. first-line NSCLC checkpoint inhibitors, second-line-plus melanoma), the system queries ClinicalTrials.gov for all Phase 2 and Phase 3 interventional trials. It captures the modal primary endpoint, typical comparator, standard biomarkers, expected sample size range, design architecture, and sponsor composition. Line-of-therapy splitting reduced the false flagging rate from 61% to 44%. Currently 17 indication–modality pairs with 75 baseline files (21 combined, 54 line-specific) built from 4,000+ real trials.
New trials are scored with a weighted composite formula
Each new or updated trial is compared against its baseline across six dimensions. A weighted composite anomaly score ranks candidates by severity — endpoint choice (weight 3.0), comparator strategy (2.0), design architecture (2.0), biomarker enrichment (1.5), and sample size (1.0). Scores reflect rarity: a trial using an endpoint present in 2% of the baseline scores higher than one at 40%. Trials below a threshold of 3.0 are excluded. This reduced daily candidates from ~118 to ~93.
First-in patterns are detected
A separate detection stage checks the top 20 daily candidates for three novel entry patterns: first_sponsor (no prior trials in this baseline), first_phase3 (drug entering Phase 3 for the first time in this indication), and first_combination (two agents not previously tested together). Any first-in detection adds a +3.0 boost, ensuring novel competitive entries always reach investigation.
Anomalies are investigated through adaptive chains
The top five candidates each day are investigated by an autonomous agent using ChEMBL, Open Targets, bioRxiv, openFDA, PubMed, and the EU Clinical Trials Information System. Investigation chains adapt to the deviation type: endpoint deviations trigger regulatory guidance searches; novel compounds trigger mechanism lookups. Bounded by a budget of 10–20 API calls per candidate.
Confidence filter and watchlist
Every anomaly must pass three checks: is the deviation real? Is it novel? Can it be triangulated? Findings that pass are emailed; silence means no anomalies. Reported trials are added to a persistent watchlist that monitors for status changes (terminated, withdrawn, suspended), endpoint amendments, and enrolment changes exceeding 20%. Currently tracking 93 active trials.
Six deviation dimensions
Endpoint deviation
Primary endpoint does not match the baseline's modal endpoint for its indication–modality pair.
Comparator deviation
Trial uses a comparator type (active, placebo, or none) that diverges from the baseline distribution.
Enrichment deviation
Eligibility criteria include a novel biomarker or omit one that the baseline shows as standard.
Sample size deviation
Enrolment target falls outside the baseline's interquartile range for its phase.
Design deviation
Trial uses a design architecture (basket, umbrella, adaptive platform) not represented in the baseline.
New entrant deviation
A sponsor or therapeutic modality not previously seen in this indication's baseline.
What makes this different
Anomaly detection, not landscape analysis
The system does not attempt to track all oncology trials. It builds baselines of what is normal at the indication–modality–line-of-therapy level, then scores deviations using a weighted composite formula. Most trials match their baseline and are filed without analysis. Only high-scoring deviations receive investigation and reporting.
Investigation, not just flagging
Detecting a deviation is not sufficient. The system investigates each anomaly through adaptive chains — searching for regulatory guidance changes, competitor readouts, safety signals, and published validation studies. Findings are reported as "explained" or "unexplained" — the latter often the most interesting.
All public, free data sources
ClinicalTrials.gov, EU CTIS, ChEMBL, Open Targets, bioRxiv, openFDA, PubMed, and conference abstracts (ASCO/ESMO/ASH) — all accessed via free public APIs. No commercial data subscriptions required. Reproducible by any research group.
Autonomous direction discovery
Four discovery mechanisms layer on top of daily detection: unmatched trial analysis surfaces blind spots in baseline coverage, temporal trend detection identifies endpoint drift and biomarker adoption, cross-trial convergence finds independent sponsors making the same unusual design choice, and sponsor portfolio tracking detects strategic moves like new indication entries or withdrawal clusters.
Illustrative baseline data
Different indication–modality pairs exhibit meaningfully different design conventions. NSCLC Phase 3 trials concentrate heavily on progression-free survival (36.8% of primary endpoint designations), creating a clear baseline against which deviations are detectable. Melanoma trials distribute more evenly across PFS, ORR, OS, and DFS — requiring a higher deviation threshold.
NSCLC Phase 3 (100 trials, 136 endpoints)
- PFS dominates at 36.8% — a new trial choosing DoR or a PRO as sole primary endpoint would constitute a deviation
- OS is second at 22.8%, consistent with regulatory precedent
- DFS at 9.6% reflects perioperative trial designs
- "Other" endpoints at 11.0% — manageable heterogeneity
Melanoma Phase 3 (50 trials, 72 endpoints)
- PFS, ORR, OS, and DFS each represent 12–23% — no single dominant endpoint
- "Other" category at 36.1% — substantial heterogeneity from broad clinical spectrum
- Adjuvant, metastatic, and response-focused trial designs coexist
- Higher deviation threshold required to avoid false positives
Operational anomaly findings
The following scenarios are drawn from the first week of operational deployment (13–20 March 2026) to illustrate the types of anomalies the system detects in practice.
First-in sponsor: olaparib in bladder cancer
AstraZeneca registered a Phase 3 trial of olaparib in bladder cancer without BRCA or HRR biomarker enrichment. Flagged as a first_sponsor deviation (no prior AstraZeneca trials in bladder × checkpoint-inhibitor baseline) and an enrichment deviation (omitting biomarker selection in a PARP inhibitor trial is unusual). Investigation via ChEMBL and PubMed found no published rationale for biomarker-unselected PARP inhibition in bladder cancer. Classified as "unexplained" — the most interesting category.
First Phase 3 for a novel mechanism: 4-1BB agonist in NSCLC
BioNTech's acasunlimab (a 4-1BB agonist) reached Phase 3 in NSCLC. The system detected a first_phase3 pattern: no 4-1BB agonist had previously entered Phase 3 in NSCLC. The +3.0 first-in boost elevated this trial above several higher-scoring baseline deviations, reflecting the clinical significance of a new mechanism class reaching late-stage development.
Convergent signals: mRNA in bladder cancer
In the same week, Roche and Merck both opened trials with mRNA-based components in bladder cancer. Neither company had prior bladder cancer mRNA trials. The system detected both as individual first_sponsor anomalies but did not automatically link them — highlighting the need for the cross-trial convergence detection mechanism now being implemented.
Limitations to be aware of: baselines depend on ClinicalTrials.gov data quality, which is sponsor-submitted and intentionally vague on design rationale. Indication–modality pairs with fewer than 15 trials cannot be monitored. The scoring weights (endpoint 3.0, comparator 2.0, etc.) were set based on clinical judgment, not empirical optimisation — the feedback mechanism is intended to enable data-driven calibration but requires months of sustained engagement. The system detects anomalous design choices — it does not assess whether those choices are good or bad. An experienced oncology analyst scanning the registry weekly would likely identify the same high-impact findings; the system's advantage is consistency and coverage, not clinical judgment. No prospective validation has been performed.
In Development
Knowledge Graph
ScienceClaw's third layer of intelligence: a persistent, growing graph that connects trials, drugs, mechanisms, sponsors, indications, and clinical findings across all three workflows — enabling convergence signals, strategic pivot detection, and cross-thread triangulation that flat-file analysis cannot produce.
The Knowledge Graph is currently under active development. The backbone architecture and Tier 1 ingest are complete. Tier 2 extraction and Tier 3 gap-fill agents are in the implementation phase. This page describes the design intent and the insights it is built to produce.
Why a knowledge graph
ScienceClaw's Trial Intelligence workflow detects individual anomalies. Its Oncology Insights workflow synthesises news into themes. Both produce valuable output — but they operate in isolation. A trial flagged as anomalous by Thread 2 and a bioRxiv preprint catalogued by Thread 3 might share a mechanism and an indication, forming a potential explanation. In the current architecture, no process connects them.
The Knowledge Graph solves this. Every entity — trial, drug, sponsor, mechanism, indication, regulatory event, KB theme — becomes a node. Every relationship becomes a traversable edge with a confidence score and a source reference. Cross-thread triangulation, multi-sponsor convergence detection, and regulatory impact propagation all become single graph queries rather than multi-pass scripting tasks.
The graph is built in Python using NetworkX, stored as a single JSON file, and updated daily after Trial Intelligence completes. There is no database server. The entire graph fits in memory. All queries run in the same process as the rest of ScienceClaw.
Three tiers of evidence
What the graph enables
Cross-trial convergence detection
The graph holds every trial's sponsor, mechanism, and indication as connected nodes. A single query can find indication–mechanism pairs where two or more independent sponsors have opened trials within a defined time window — a convergence signal that no analyst scanning CT.gov linearly would reliably catch. The mRNA-in-bladder-cancer case from week one of deployment (two independent sponsors, same week, neither individually anomalous) is exactly the pattern this query is designed to surface automatically.
Sponsor portfolio pivot detection
Each sponsor's full trial history is encoded in the graph. When a new trial registers in an indication the sponsor has never entered before, the graph computes this as a first-indication event automatically — queryable retroactively across any time window and comparable across all sponsors simultaneously, without manual cross-referencing of state files.
Cross-thread triangulation
Thread 2 flags an unexplained anomaly: a PARP inhibitor trial with no biomarker enrichment. Thread 3's KB holds a bioRxiv preprint noting HRR signals in that tumour type. In the current flat-file architecture these two items never meet. In the graph, both connect to the same Indication and Mechanism nodes — a query surfaces the potential explanation automatically, and GLM-5 reasons over the subgraph rather than 40KB of markdown.
Regulatory signal propagation
When ODAC issues updated guidance on a surrogate endpoint, Thread 3's KB records the regulatory event as a node. The graph already holds all trials using that endpoint. A gap-fill agent proposes AFFECTED_BY edges connecting those trials to the regulatory event — automatically surfacing which watchlist trials face regulatory risk, without any manual lookup.
Design principles
Every edge has a source
No edge is inserted without a source_id — an NCT ID, ChEMBL ID, URL, or KB file path. An edge without a traceable source is rejected at insertion. This is enforced by the single write-access script, not by convention.
Confidence is computed, not declared
Every edge carries a confidence score between 0.0 and 1.0, set by deterministic rules based on the number and tier of supporting sources. The LLM never self-assesses confidence for graph insertion purposes — that would introduce the same overconfidence problem the cross-model verification architecture was designed to solve.
Single write-access chokepoint
One script — kg_writer.py — is the only process with write access to the graph. All ingest scripts, extraction agents, and gap-fill agents submit operations to a batch queue. This creates a single auditable point where schema rules are enforced before any data reaches the graph.
Tier 3 always reviewed
Agent-inferred edges — convergence signals, regulatory propagation, cross-thread links — go to a daily proposals queue before graph insertion. A digest email summarises pending proposals. Auto-approval requires a source reference and confidence ≥ 0.8. Inferred edges below this threshold always require explicit approval. This mirrors the term discovery discipline already in place across Threads 1 and 3.
Queries are confidence-filtered
Every query that feeds an emailed report filters on a minimum confidence threshold. A convergence finding derived solely from Tier 3 inferred edges is flagged as lower-certainty. A finding supported by multiple Tier 1 edges is flagged as high-certainty. The graph never flattens this distinction.
No database server
The graph runs as a Python object in-process, serialised to a single JSON file after each write session using an atomic rename. No port, no service to supervise, no failure mode from a database process being killed during a cron window. At the scale of this system — a few thousand nodes at maturity — this is the right choice.
Honest limitations
The alias problem is real and requires sustained maintenance. Pembrolizumab, Keytruda, MK-3475, and pembro are the same drug — but CT.gov, ChEMBL, news coverage, and conference abstracts use all four. Without a continuously maintained canonical name table, these appear as four separate Drug nodes and convergence queries produce false negatives. The canonical table grows automatically as aliases are resolved, but the first weeks will have meaningful alias noise. Tier 2 edges derived from GLM-5 extraction will have a non-trivial error rate in the first months — estimated 15–25% on entity resolution — until the extraction prompt is tuned against real KB output. Tier 3 inferred relationships are genuinely uncertain; the confidence scores reflect this, but they do not guarantee correctness. The graph improves with time; early outputs should be treated as exploratory signals, not confirmed intelligence.
Live knowledge graph
Updated daily after the 15:50 pipeline run. Nodes are coloured by type — trials, drugs, sponsors, mechanisms, indications, and findings. Edge thickness reflects confidence score. Click any node to inspect its properties.